Solana Surges Towards New Monthly Peaks
London: 26 July 2024 (TraderMade): Solana (SOL) is making significant strides as it targets a new monthly high. Following a robust upward movement from the $165 zone, the SOL price is exhibiting strong bullish signals, hinting at a potential rise above the $182.50 resistance level.
Key Takeaways
- Bullish Momentum: Solana's price is showing strong upward movement from the $165 support, aiming to break the $182.50 resistance level.
- Critical Levels: Key support levels are at $172 and $170, with major resistance levels at $175 and $182.50. If surpassed, these levels could potentially lead to $200.
SOL Price Gains Momentum
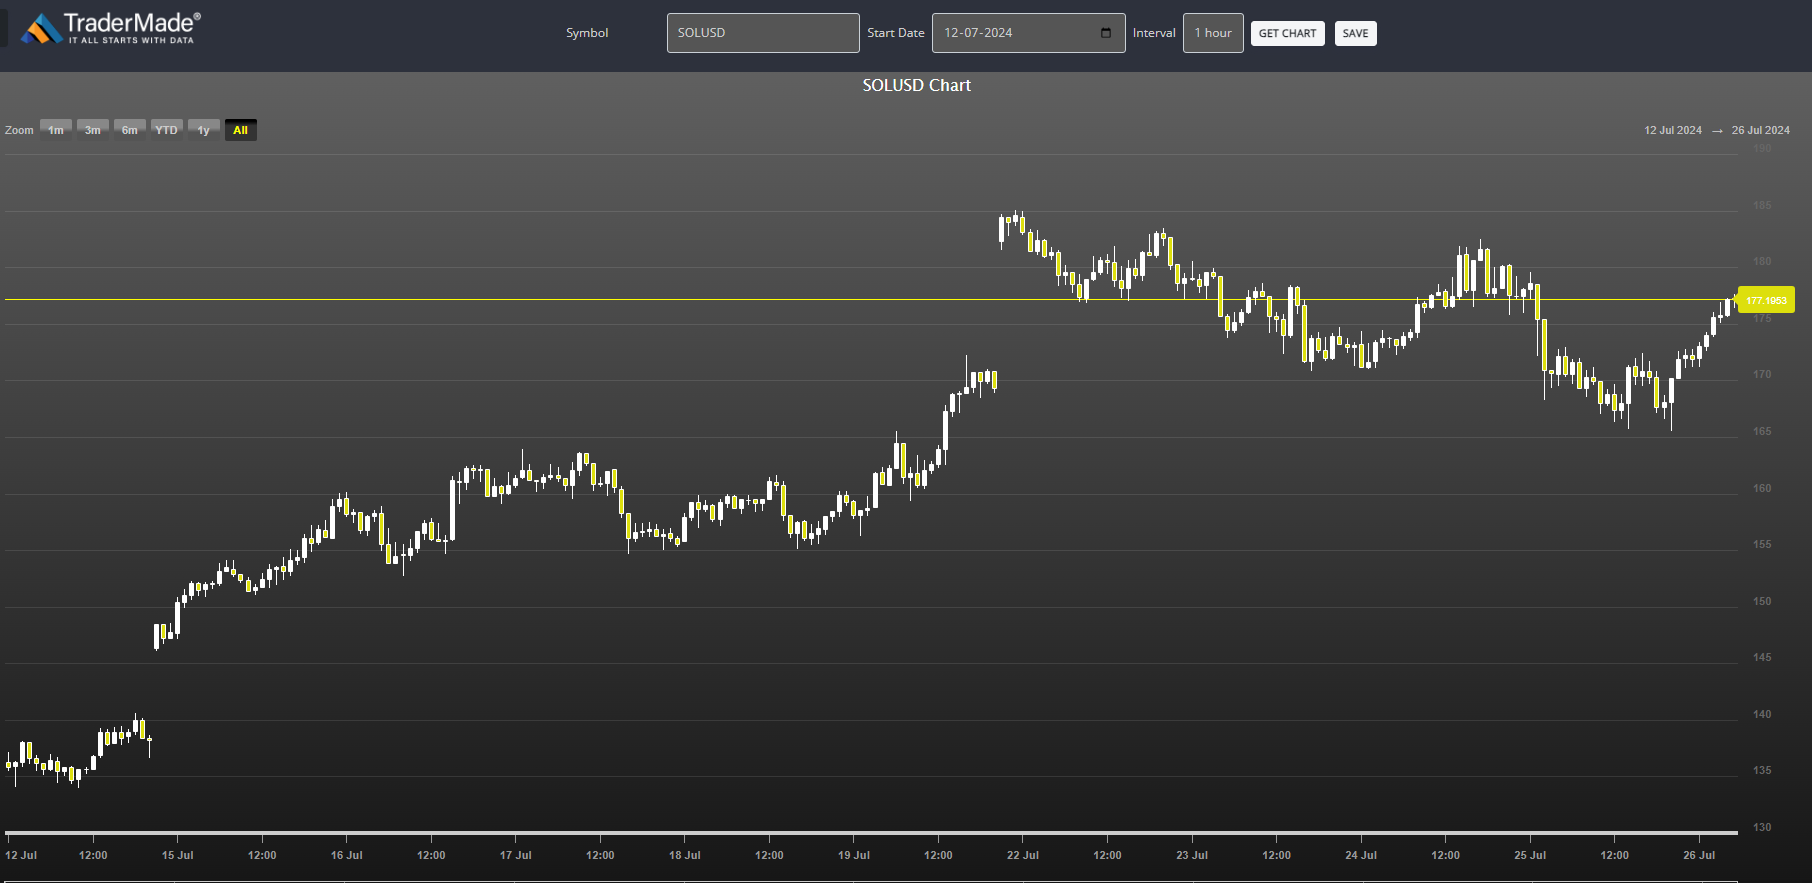
SOL initiated a notable upward trajectory from the $165 support level against the US Dollar. Currently, it is trading around $175, hovering near the 100-hourly simple moving average. A key technical event indicates that SOL/USD has broken past a connecting bearish trend line, encountering resistance at $170.
This data comes from Kraken. This break suggests the possibility of further upward movement if SOL manages to surpass the $182.50 resistance level.
Solana Price Remains in a Positive Zone Above $165
After a downside correction, SOL found support at $165, similar to the trends observed in Bitcoin and Ethereum. It dipped below the $175 and $172 support levels, eventually testing the $165 mark. A low was established at $165.12, from which the price began to rise again.
SOL broke through the $170 and $172 resistance levels, climbing past the 50% fiber retracement level of the previous downward move from the $182.51 high to the $165.12 low. Additionally, the break above the bearish trend line resistance at $170 reinforced its bullish stance.
Key Resistance and Potential Upsides
Currently, Solana is encountering resistance near the $175 level, which aligns with the 61.8% Fib retracement level of the mentioned downward move. The primary resistance to watch is at $182.50.
A decisive close above this level could pave the way for a steady increase, with the next major resistance around $192. Further gains might propel the price toward the $200 milestone.
Are Dips Limited in SOL?
Should SOL struggle to clear the $182.50 resistance, it may face a pullback. Initial support lies near the $172 level, with the first major support at $170. A breach below $170 could lead to a decline toward the $165 support. If SOL closes below this level, a further drop toward $155 is possible in the near term.
Technical Indicators
- Hourly MACD: The MACD for SOL/USD is gaining momentum in the bullish zone.
- Hourly RSI: The Relative Strength Index for SOL/USD is above the 50 level, indicating a bullish sentiment.

Support and Resistance Levels
- Major Support Levels: $172, $170
- Major Resistance Levels: $175, $182.50
Conclusion
Solana's recent price movements indicate a positive trend with the potential for further gains if it manages to break through key resistance levels. Investors are optimistic as SOL targets new monthly highs, keeping an eye on the critical $182.50 resistance.
The bullish technical indicators and overall market sentiment suggest that SOL could continue its upward journey, possibly reaching the $200 level in the near future.


