Ethereum Price Poised for Steady Recovery
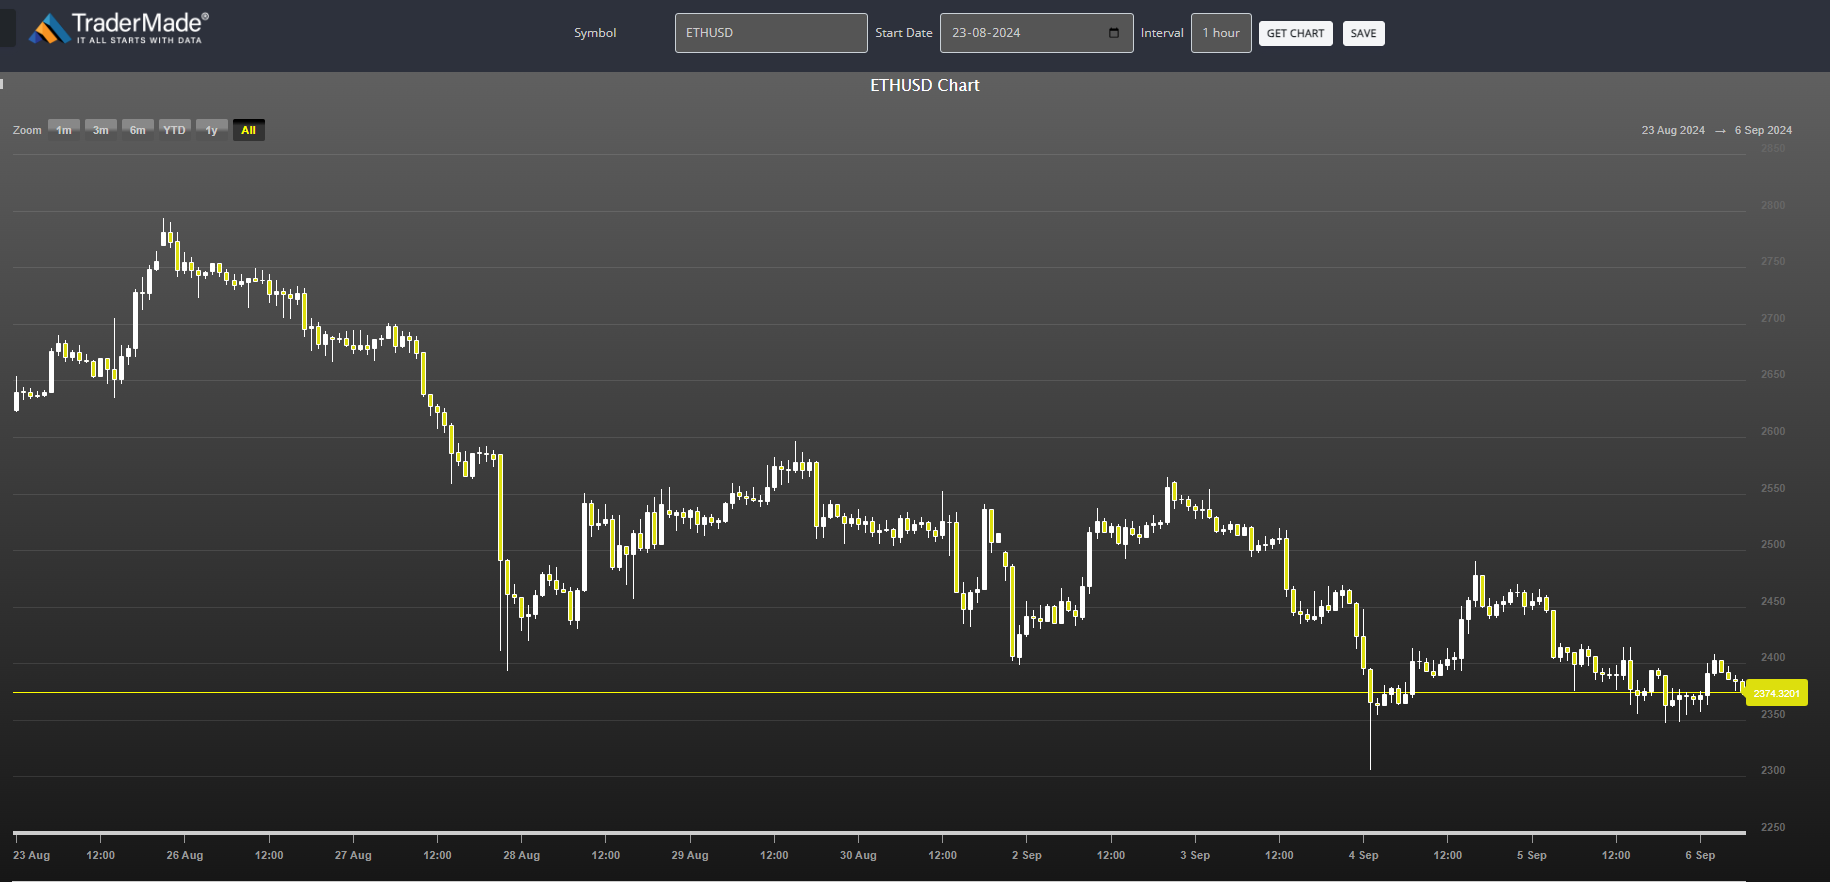
London: 6 September 2024 (TraderMade): Ethereum is showing signs of a potential recovery after testing the $2,350 support zone. In recent days, the cryptocurrency attempted to climb above key resistance levels, but it now faces a crucial challenge at $2,440.
Key Takeaways
- Ethereum must break $2,440 to continue its upward momentum.
- Failure to hold $2,350 support may lead to another decline toward $2,310.
Attempted Recovery
After hitting a low of $2,347, Ethereum rebounded, moving past resistance levels of $2,365 and $2,380. However, the price remains below the critical $2,440 mark and the 100-hourly Simple Moving Average (SMA), signaling that a decisive breakout is still needed for further upside.
Key Resistance
A key hurdle stands in the form of a bearish trend line, which is currently offering resistance at $2,400. If ETH can break through the $2,440 resistance, it could pave the way for an extended recovery toward $2,500 and potentially $2,550.
An upside break above $2,550 could even drive the price higher toward the $2,720 resistance zone.
Potential Upside Targets
If Ethereum manages to clear the $2,440 resistance, further upside targets include the $2,500 and $2,550 levels. Breaking through these could see ETH rise toward the $2,720 resistance zone in the near term, signaling a more sustainable recovery.
Risk of Another Decline
On the flip side, if Ethereum struggles to break through $2,440, it risks falling back. Initial support lies at $2,365, with a more substantial floor at $2,350. A failure to hold these levels could push ETH toward $2,310 or even $2,250, marking another leg down in the short term.
Support Levels to Watch
The critical support to watch is $2,350. If the price fails to hold above this level, it could trigger a decline toward $2,310 and possibly even $2,250. Any further losses could see ETH test the next key support at $2,120.
Technical Indicators Overview
- MACD: The hourly MACD is losing momentum in the bearish zone, hinting at a slowdown in downward pressure.
- RSI: The RSI has climbed above the 50 mark, suggesting that bulls may still have a chance to take control.

Outlook: Bullish or Bearish?
Ethereum’s next steps will be crucial, with $2,440 acting as a make-or-break level. Should bulls manage to clear this resistance, the crypto may be poised for further gains. However, failure to clear this level could see ETH revisiting key support levels soon.


