Ethereum Price Analysis
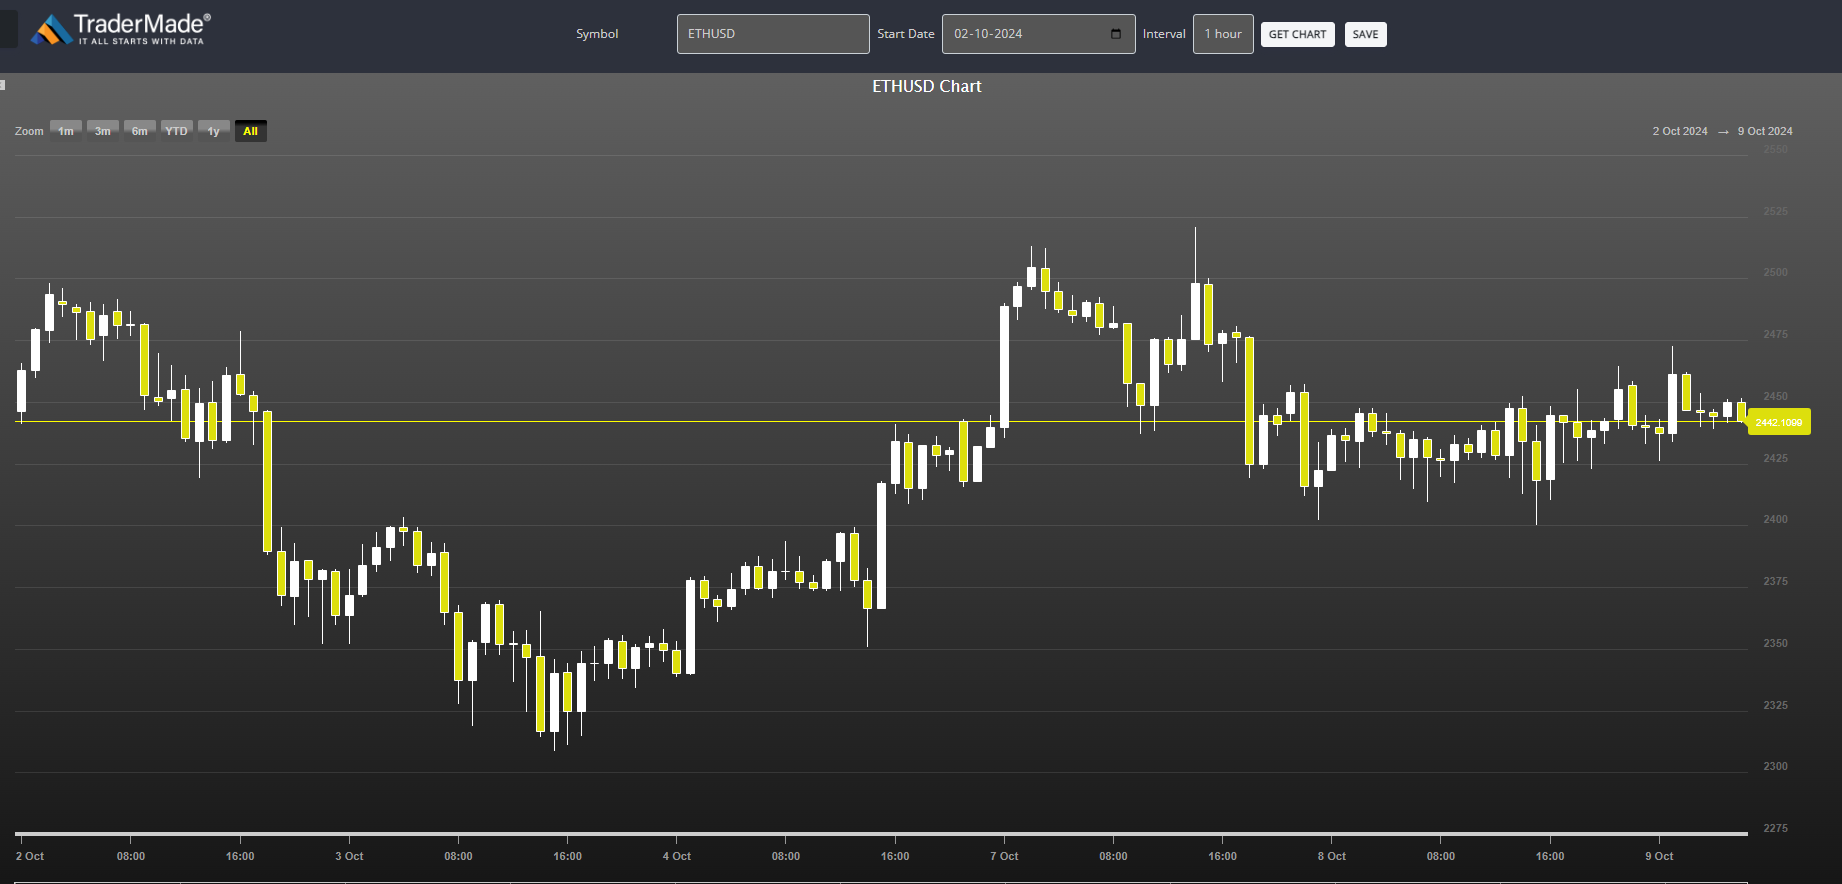
London: 9 October 2024 (TraderMade): Ethereum's recent price action has caught the attention of market participants as the cryptocurrency corrected from recent highs, dipping below the critical $2,500 level. This drop mirrors the broader trend in the market, with Bitcoin also losing some ground.
However, ETH seems to have found a temporary footing, holding steady above the $2,400 support level, suggesting that the asset is in a consolidation phase.
Key Takeaways
- Ethereum holds above the key $2,400 support level after a recent pullback.
- Short-term resistance at $2,465 remains a key level.
The Technical Picture
After reaching a high near $2,519, Ethereum entered a downside correction, retracing below key support levels, including $2,465 and $2,420. The price managed to stay above $2,400, a critical juncture for both bulls and bears.
The support level coincides with the 50% Fibonacci retracement of the price movement from the $2,310 low to the $2,519 high. This alignment indicates that it's not just a psychological support but also a technical one.
On the hourly chart, ETH/USD is trading just above $2,430 and the 100-hourly Simple Moving Average, signalling that short-term momentum remains positive as long as this average is not breached decisively. Additionally, a short-term rising channel is forming with support of around $2,420. This pattern typically indicates that buyers are attempting to build strength for a potential upward move.
Resistance Levels and Potential Upside
The current price structure suggests that Ethereum is facing immediate resistance at the $2,465 level. A break above this could open the gates for a retest of $2,500, a psychologically significant barrier that has acted as a resistance zone in recent sessions.
If bulls manage to push ETH above $2,500, the next target would likely be around $2,600, with intermediate resistance near $2,550. Clearing $2,600 could catalyze a larger rally, potentially setting the stage for a move toward the $2,665 resistance level.
Risk of Further Decline?
However, should Ethereum fail to maintain its position above $2,465, it risks entering another downward phase. The first line of defence on the downside lies at $2,420. A breach below this could expose ETH to a drop towards the major support at $2,390, which also corresponds to the 61.8% fibre retracement level.
A breakdown below $2,390 would be concerning for bulls, as it could push the price down to $2,325 and even further to $2,240, where the next key support awaits. Such a move would negate any short-term bullish momentum and potentially set the tone for a prolonged period of consolidation or further losses.
Technical Indicators at a Glance
The hourly MACD for ETH/USD is currently losing momentum in the bearish zone, suggesting a lack of immediate strength in buying interest. Meanwhile, the RSI has edged above 50, hinting at a slight bullish bias. These indicators, while mixed, underline the indecision currently seen in Ethereum's price action.

Conclusion
Ethereum's ability to defend the $2,400 support will be crucial in the coming days. A successful hold and a subsequent break above $2,465 could fuel a move back towards $2,500 and beyond. Conversely, a failure to maintain current levels might lead to a deeper correction.


